All widgets
Activity Monitor
Comes with Chopstick
CPU and memory use with the busiest processes, like a glance at Activity Monitor; opens the full app from the card.
Already installed? It's in your widget library.
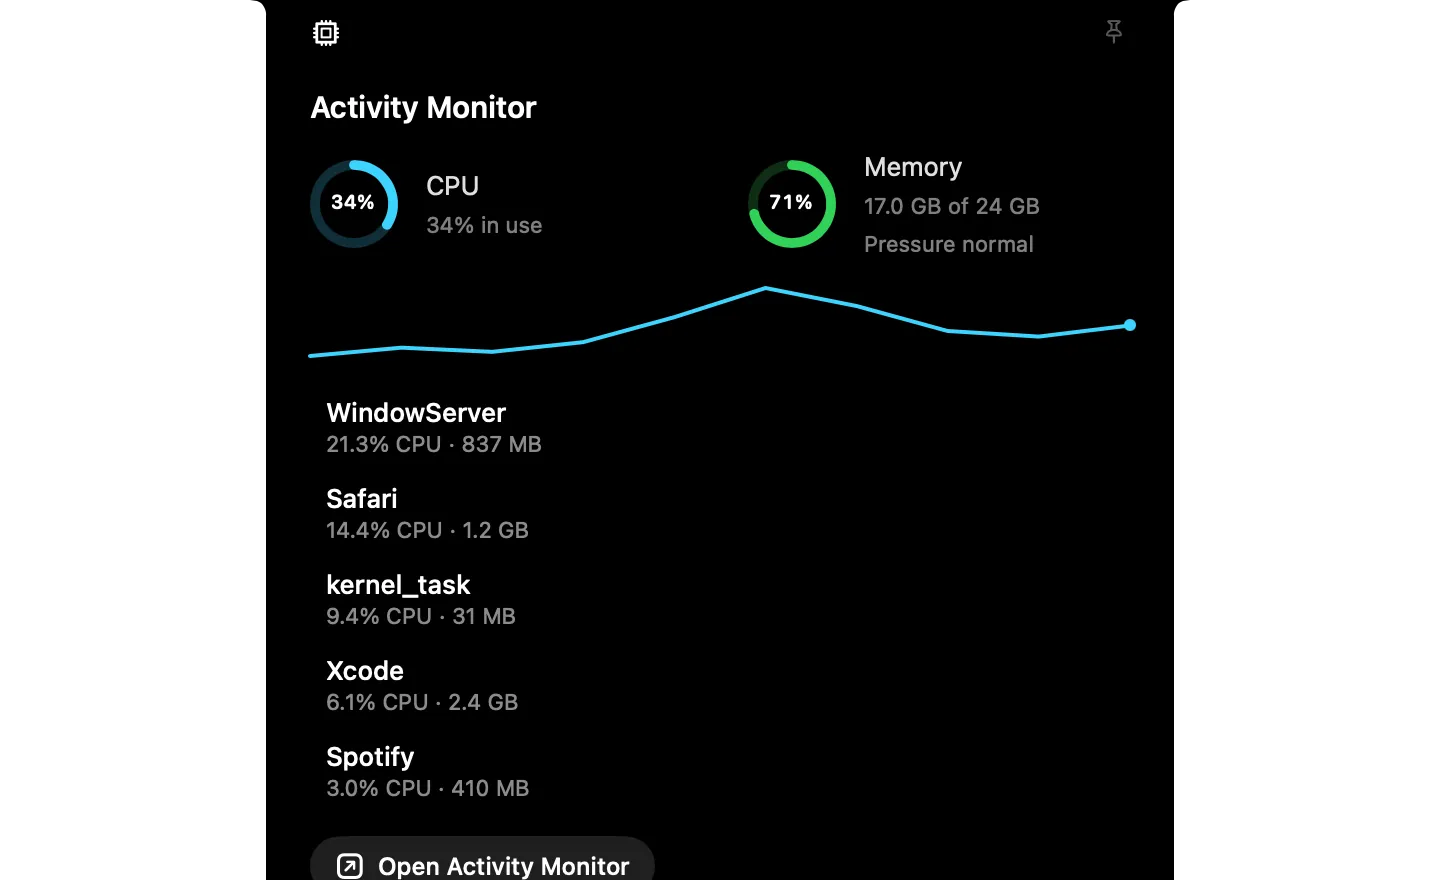
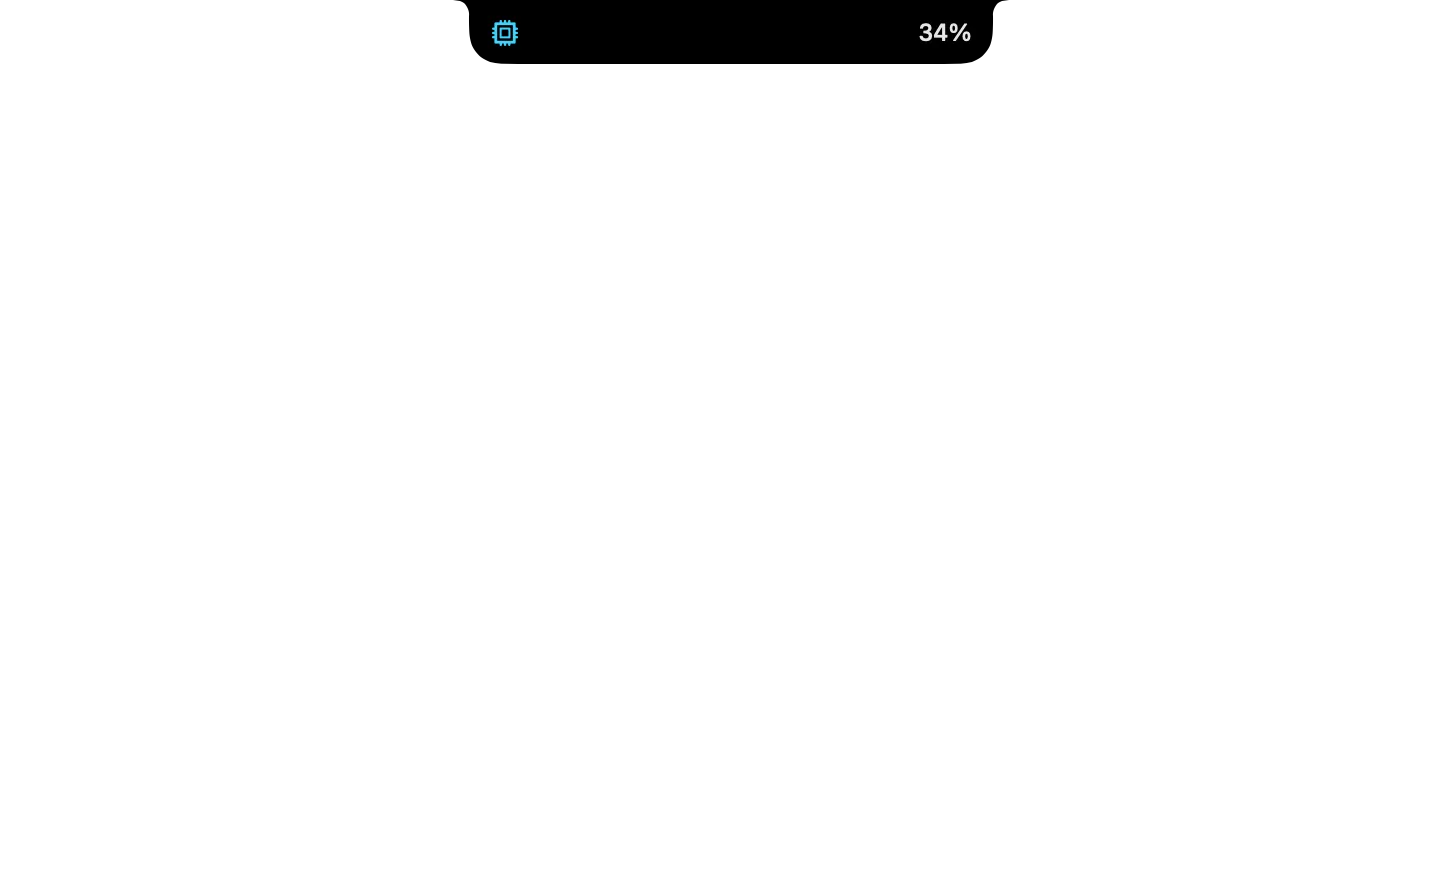
Type it in the notch's search
- Show CPU and memory
- Open Activity Monitor
What it runs
A widget is a folder of plain files. Here is all of its code.
widget.json
{
  "id": "activity-monitor",
  "name": "Activity Monitor",
  "icon": "icon.png",
  "description": "CPU and memory use with the busiest processes, like a glance at Activity Monitor; opens the full app from the card.",
  "anytime": true,
  "watch": [
    {
      "script": "stats.sh",
      "every": 3,
      "as": "sys"
    }
  ],
  "initial": "glance",
  "states": {
    "glance": {
      "compact": {
        "leading": {
          "symbol": "cpu",
          "tint": "{{sys.cpu_tint | gray}}"
        },
        "trailing": {
          "text": "{{sys.cpu_label | …}}"
        }
      },
      "expanded": {
        "size": "regular",
        "header": {
          "symbol": "cpu",
          "title": "Activity Monitor"
        },
        "blocks": [
          {
            "row": [
              {
                "ring": {
                  "value": "{{sys.cpu | 0}}",
                  "max": "100",
                  "label": "{{sys.cpu_label}}",
                  "size": "medium",
                  "tint": "{{sys.cpu_tint | cyan}}"
                }
              },
              {
                "stack": [
                  { "text": "CPU", "style": "body" },
                  { "note": "{{sys.cpu_label | …}} in use" }
                ],
                "align": "leading",
                "spacing": "tight"
              },
              "spacer",
              {
                "ring": {
                  "value": "{{sys.mem_pct | 0}}",
                  "max": "100",
                  "label": "{{sys.mem_pct}}%",
                  "size": "medium",
                  "tint": "{{sys.mem_tint | green}}"
                }
              },
              {
                "stack": [
                  { "text": "Memory", "style": "body" },
                  { "note": "{{sys.mem_used | …}} of {{sys.mem_total}}" },
                  { "note": "Pressure {{sys.pressure | normal}}" }
                ],
                "align": "leading",
                "spacing": "tight"
              }
            ],
            "align": "center"
          },
          {
            "sparkline": {
              "from": "sys.history",
              "tint": "{{sys.cpu_tint | cyan}}"
            }
          },
          {
            "list": {
              "from": "sys.procs",
              "limit": 5,
              "title": "{{item.name}}",
              "subtitle": "{{item.cpu}} CPU · {{item.mem}}"
            }
          },
          {
            "button": {
              "symbol": "arrow.up.forward.app",
              "label": "Open Activity Monitor",
              "do": [
                { "run": "open.sh" }
              ]
            }
          }
        ]
      },
      "keys": [
        {
          "key": "cmd+o",
          "label": "Activity Monitor",
          "do": [
            { "run": "open.sh" }
          ]
        }
      ]
    }
  },
  "commands": {
    "show": {
      "description": "Show CPU and memory use and the busiest processes.",
      "phrase": "Show CPU and memory",
      "do": [
        { "go": "glance" }
      ]
    },
    "open": {
      "description": "Open the Activity Monitor app.",
      "phrase": "Open Activity Monitor",
      "do": [
        { "run": "open.sh" }
      ]
    }
  },
  "preview": {
    "states": [
      "glance"
    ],
    "data": {
      "sys": {
        "cpu": 34,
        "cpu_label": "34%",
        "cpu_tint": "cyan",
        "history": [12, 18, 15, 22, 40, 61, 48, 30, 26, 34],
        "mem_pct": 71,
        "mem_used": "17.0 GB",
        "mem_total": "24 GB",
        "pressure": "normal",
        "mem_tint": "green",
        "procs": [
          { "pid": 405, "name": "WindowServer", "cpu": "21.3%", "mem": "837 MB" },
          { "pid": 38418, "name": "Safari", "cpu": "14.4%", "mem": "1.2 GB" },
          { "pid": 0, "name": "kernel_task", "cpu": "9.4%", "mem": "31 MB" },
          { "pid": 37784, "name": "Xcode", "cpu": "6.1%", "mem": "2.4 GB" },
          { "pid": 527, "name": "Spotify", "cpu": "3.0%", "mem": "410 MB" }
        ]
      }
    }
  }
}
open.sh
#!/bin/sh
open -a "Activity Monitor"
stats.sh
#!/bin/sh
# CPU, memory and the busiest processes from a one-second `top` sample, as one JSON object.
# The last 30 CPU readings are kept in $CHOPSTICK_STORAGE for the sparkline.
OUT=$(top -l 2 -n 6 -o cpu -s 1 -stats pid,command,cpu,mem 2>/dev/null) || { echo "Couldn't read top" >&2; exit 1; }
# top's first sample counts since boot; keep the second.
OUT=$(printf '%s\n' "$OUT" | awk '/^Processes:/ { n++ } n == 2')

CPU=$(printf '%s\n' "$OUT" | awk '/^CPU usage:/ { for (i = 1; i <= NF; i++) if ($i == "idle") { sub("%", "", $(i-1)); printf "%d", 100 - $(i-1) + 0.5 } }')
[ -n "$CPU" ] || CPU=0
# Used like Activity Monitor counts it: app memory (anonymous minus purgeable), wired and compressed.
USED_GB=$(vm_stat | awk '
  /page size of/ { size = $8 }
  /^Anonymous pages/ { a = $NF } /^Pages purgeable/ { p = $NF }
  /^Pages wired down/ { w = $NF } /^Pages occupied by compressor/ { c = $NF }
  END { printf "%.1f", (a - p + w + c) * size / 1073741824 }')
TOTAL=$(( $(sysctl -n hw.memsize) / 1073741824 ))
MEM_PCT=$(awk -v u="$USED_GB" -v t="$TOTAL" 'BEGIN { printf "%d", u / t * 100 + 0.5 }')
# 1 normal, 2 warning, 4 critical
case $(sysctl -n kern.memorystatus_vm_pressure_level 2>/dev/null) in
  4) PRESSURE="critical"; MEM_TINT="red" ;;
  2) PRESSURE="high"; MEM_TINT="yellow" ;;
  *) PRESSURE="normal"; MEM_TINT="green" ;;
esac

if   [ "$CPU" -ge 80 ]; then CPU_TINT="red"
elif [ "$CPU" -ge 50 ]; then CPU_TINT="orange"
else CPU_TINT="cyan"; fi

HISTORY=""
if [ -n "$CHOPSTICK_STORAGE" ]; then
  mkdir -p "$CHOPSTICK_STORAGE"
  F="$CHOPSTICK_STORAGE/cpu"
  { cat "$F" 2>/dev/null; echo "$CPU"; } | tail -30 > "$F.new" && mv "$F.new" "$F"
  HISTORY=$(paste -sd, "$F")
fi
[ -n "$HISTORY" ] || HISTORY=$CPU

# Rows after the PID header, without top itself: "75769  swift-frontend   69.1 655M+".
# top cuts names at 16 characters, so the names come from ps where it can tell (not kernel_task).
ROWS=$(printf '%s\n' "$OUT" | awk '/^PID/ { rows = 1; next } rows && NF >= 4 && $2 != "top" { $0 = $1 " " $(NF-1) " " $NF " " substr($0, index($0, $2)); NF -= 2; print }' | head -5)
PIDS=$(printf '%s\n' "$ROWS" | awk '{ print $1 }' | paste -sd, -)
PROCS=$( { ps -o pid=,comm= -p "$PIDS" 2>/dev/null; echo "--"; printf '%s\n' "$ROWS"; } | awk '
  $0 == "--" { rows = 1; next }
  !rows { pid = $1; sub(/^ *[0-9]+ /, ""); n = split($0, parts, "/"); names[pid] = parts[n]; next }
  {
    name = $4; for (j = 5; j <= NF; j++) name = name " " $j; if ($1 in names) name = names[$1]; gsub(/["\\]/, "", name)
    mem = $3; sub(/[+-]$/, "", mem); u = substr(mem, length(mem)); v = mem + 0
    if (u == "K") v /= 1024; if (u == "G") v *= 1024; if (u == "B") v /= 1048576
    mem = v >= 1024 ? sprintf("%.1f GB", v / 1024) : sprintf("%d MB", v + 0.5)
    printf "%s{\"pid\":%d,\"name\":\"%s\",\"cpu\":\"%s%%\",\"mem\":\"%s\"}", (i++ ? "," : ""), $1, name, $2, mem
  }')

printf '{"cpu":%d,"cpu_label":"%d%%","cpu_tint":"%s","history":[%s],"mem_pct":%d,"mem_used":"%s GB","mem_total":"%d GB","pressure":"%s","mem_tint":"%s","procs":[%s]}\n' \
  "$CPU" "$CPU" "$CPU_TINT" "$HISTORY" "$MEM_PCT" "$USED_GB" "$TOTAL" "$PRESSURE" "$MEM_TINT" "$PROCS"